In an increasingly data-driven world, the investment team at Legacy realized that, through charts and graphs, we would be able to convey information more quickly and effectively. Charts also allow us to share larger sets of data with our audience, display trends and changes over time, and convey relationships between multiple data sets.
For these reasons, Gregory S. Hansen, Legacy’s Managing Director of Trust Investments, and Connor R. O’Brien, Trust Investment Officer at Legacy, developed our popular “Chart Check” series. We publish timely economic content in an easy-to-understand visual format several times a month and provide a brief explanation of the data.
Remember to visit our Chart Check page at https://www.lptrust.com/blog/category/chart-check/ or connect with us on social media to ensure you always see the most recent information.
If you are a Legacy client and have questions, please do not hesitate to contact your Legacy advisor. If you are not a Legacy client and are interested in learning more about our approach to personalized wealth management, please contact us at 920.967.5020 or info@lptrust.com.
Chart Check: Historic Drops in 2-Year Yields
Published 03.15.2023

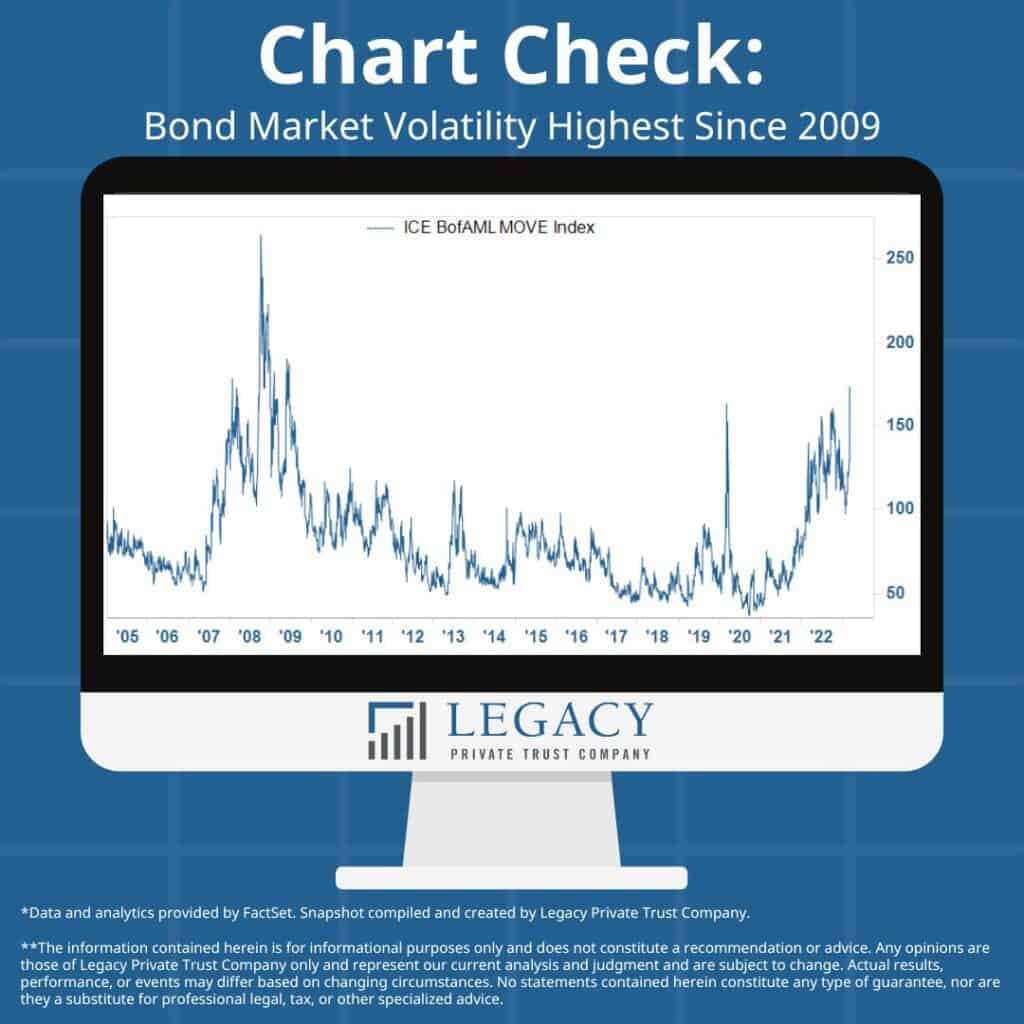
The MOVE index, a measure of fixed income volatility and the bond equivalent of the VIX, spiked to the highest level since 2009 as bond markets digest the SIVB fallout.


