A Bifurcated Housing Market in 2023

Recognizing the crucial role of data in contemporary society, the investment team at Legacy has adopted a graphical approach for rapid and efficient information conveyance. Utilizing charts and graphs, we can represent large data sets, illustrate trends and changes over time, and demonstrate relationships between multiple sets of data.

Gregory S. Hansen, Legacy’s Managing Director of Trust Investments, and Connor R. O’Brien, Trust Investment Officer at Legacy, have been instrumental in creating our well-received “Chart Check” series. This series presents pertinent economic content through comprehensible visual graphics and succinct explanations of the depicted data multiple times each month.

We encourage you to frequently visit our Chart Check page at https://www.lptrust.com/blog/category/chart-check/ or to engage with us on our social media platforms to access the latest information promptly and conveniently.

If you are a Legacy client and have questions, please do not hesitate to contact your Legacy advisor. If you are not a Legacy client and are interested in learning more about our approach to personalized wealth management, please contact us at 920.967.5020 or connect@lptrust.com.

Chart Check: A Bifurcated Housing Market

Published 06.25.2023

Bifurcated Housing Market

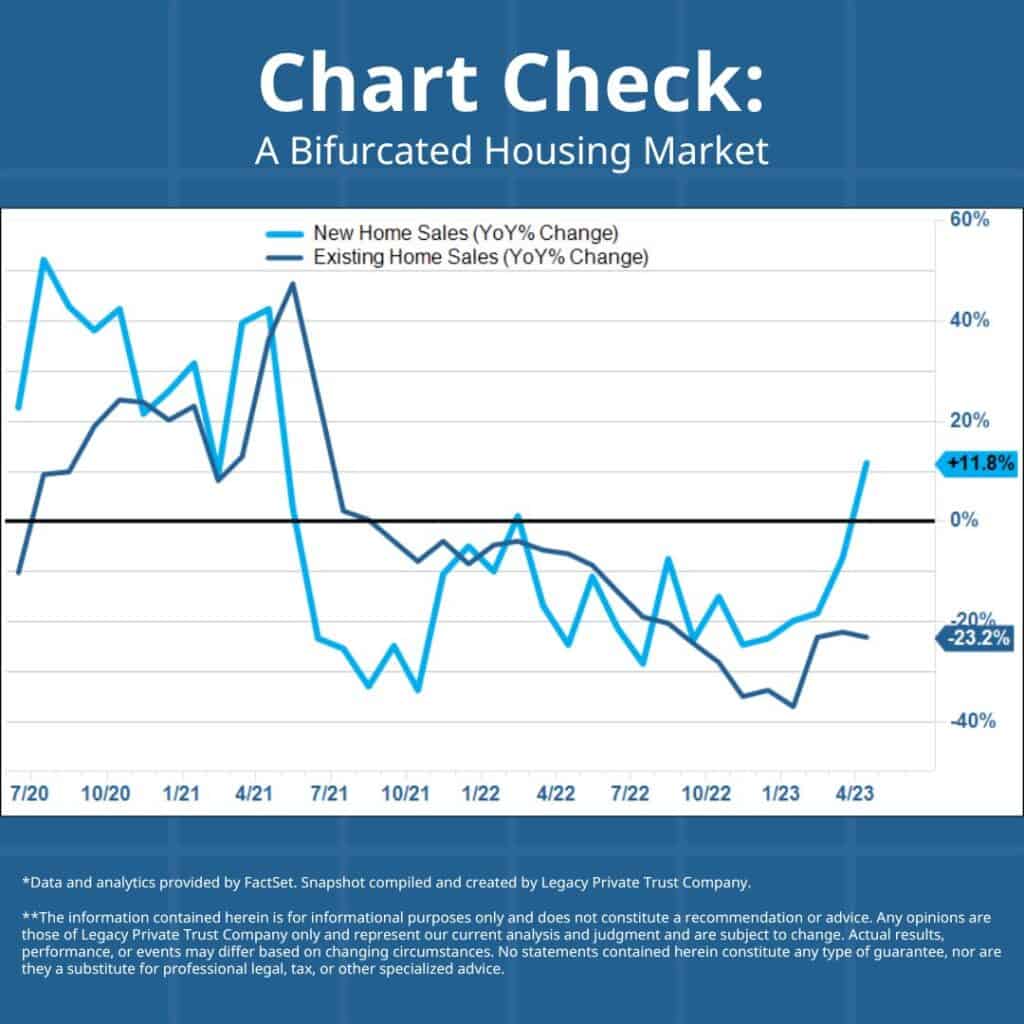
Growth in new home sales has surged to the highest level since April 2021, while sales of existing homes are down 23% from a year ago. Why? Existing homeowners are reluctant to give up their low mortgage rates, pushing buyers into newly built homes.

Stay Connected

More Updates